





















GSC URL Inspection
Enter the URL in Search Console, click “View Crawled Page,” and compare the HTML source code to confirm whether core content disappears after rendering.
Text Difference Comparison
Compare the text character count between “View Page Source” and “Inspect Element.” If the text difference rate is > 20%, there is a extremely high indexing risk.
Rich Results Test
Use the Google Rich Results Test tool to view screenshots, ensuring that critical above-the-fold content loads completely within the 5-second rendering window.
Google Official Tools
The URL Inspection tool in Google Search Console (GSC) is the entry point for obtaining live crawling data from Googlebot.
By using “Test Live URL,” you can trigger the WRS (Web Rendering Service) to generate a complete DOM structure within 60-90 seconds.
GSC provides rendered HTML, screenshots, and a list of loaded resources.
Currently, Googlebot uses the latest Chrome stable kernel, but it sets a threshold of approximately 5 seconds for script execution on a single page.
Combined with the “Rich Results Test,” you can compare the byte difference between the initial response and the final rendering results, and identify 403 or 404 script loading failures caused by Robots.txt blocking.
Google Search Console
In the sidebar navigation of Google Search Console, after entering a specific URL, the system retrieves a snapshot of the most recent crawl data from the Google index database.
If the page status shows “URL is on Google,” you can see if there were HTML parsing errors or mobile optimization issues during that crawl.
To deeply troubleshoot content missing due to JavaScript rendering, you must click the “Test Live URL” button.
This operation triggers the WRS (Web Rendering Service) to launch a headless browser based on the latest stable Chromium kernel to perform a real-time visit to the target page.
When executing rendering, WRS sets the viewport width to 1280 pixels and adopts a mobile-first crawling strategy.
In the “View Rendered Page” panel, the HTML tab displays the complete DOM structure after scripts have finished running.
Technical staff should quantitatively compare the lines of HTML code or character bytes displayed here with the “View Page Source” (original server response) seen by right-clicking in a browser.
If the original HTML is only 2KB while the rendered HTML grows to 50KB, it indicates that the page is highly dependent on client-side rendering.
If the rendered HTML lacks main text content or product list tags, it is judged as a rendering failure.
Googlebot allocates limited computing resources for script execution on a single page. Although no absolute deadline is officially given, numerous experiments show that if content loading time exceeds 5 seconds, the probability of that data being missed during the indexing stage increases significantly.
“Googlebot does not wait indefinitely for JavaScript to complete all asynchronous tasks; its rendering budget is constrained by page load speed, server response latency (TTFB), and script parsing complexity. If the API interface response time exceeds 2000 milliseconds, it often leads to content still being in a ‘Loading’ state at the moment the rendering snapshot is generated.”
Under the “More Info” tab in the “Page Resources” list, all JS and CSS files that failed to load will be listed.
Status codes 403 or 404 clearly point to server permission configuration errors or invalid resource paths, but the most important one to watch for is the “Blocked by Robots.txt” status.
Since many Single Page Applications (SPA) encapsulate routing and data rendering logic in specific script files, if the site’s /robots.txt file contains rules like Disallow: /assets/, preventing Googlebot from accessing core scripts, WRS will be unable to construct a complete DOM tree.
The result is that even if the webpage looks complete to a user in a browser, in the eyes of the search engine crawler, the page might be blank or contain only a basic framework.
Troubleshooting for script errors should focus on the “JavaScript Console Messages” area.
This section records exceptions thrown by WRS when executing code.
If the development team used new ES6+ features without Polyfills (such as BigInt, ResizeObserver, etc.), and the Chromium version corresponding to the crawl is not yet fully compatible with certain non-standard APIs, the console will show Uncaught ReferenceError or SyntaxError.
Such errors cause the entire script parsing process to interrupt, rendering all subsequent content injection logic ineffective.
By observing the specific line numbers and filenames mentioned in the error logs, you can pinpoint exactly which library file or business logic block is hindering the crawl.
The rendered “Screenshot” is another quantitative detection method.
For example, some scripts dynamically calculate the height or transparency of elements. If the screenshot shows large areas of white space, even if text exists in the HTML tags, Google’s algorithm may judge the page as user-unfriendly, thereby lowering the indexing priority.
When dealing with highly dynamic sites, you need to ensure that all Above the Fold content completes rendering within 2 seconds.
Rich Results Test
The Rich Results Test tool is a public detection environment provided by Google. Unlike Search Console, which requires site ownership verification, this tool allows anyone to analyze any URL on the public web or pasted code snippets.
After entering a URL and triggering the test, the system starts a headless browser based on the latest stable Chromium kernel to simulate the access behavior of Googlebot Smartphone or Googlebot Desktop.
For SPAs built on frameworks like React, Angular, or Vue.js, the “View Tested Page” function provided by this tool is the standard for determining whether content successfully enters the DOM tree.
Because Googlebot has a clear resource allocation limit when processing scripts, if a page needs to perform intensive calculations or initiate more than 20 asynchronous API requests during the initialization phase, WRS may end the HTML capture before the scripts finish executing.
During real-time detection, the system generates a rendered HTML snapshot.
Through this snapshot, technicians can accurately compare the byte difference between the original server response and the final rendering.
For example, a pure Client-Side Rendering (CSR) page often has less than 5KB of basic template code in its original HTML. If the HTML rendered through this tool can reach over 100KB, it indicates that Googlebot successfully executed the scripts and pulled dynamic content.
Conversely, if the rendered HTML remains around 5KB and does not include main content tags, it indicates that script execution was interrupted at the WRS level.
Google’s rendering engine sets strict timeout mechanisms for individual resource downloads, usually meaning a single JS file should not take more than 2000 milliseconds to load.
If third-party libraries or API interfaces referenced by the page respond too slowly, the “Page Resources” tab in the test results will mark the corresponding failed loading status.
- Code Snippet Test Mode: Supports pasting unreleased HTML code logic, which is crucial for testing whether JS rendering logic meets crawling standards during the Staging phase. This allows for quantitative detection of whether dynamically generated Schema markup can be correctly parsed before code is merged into the main branch.
- User-Agent Simulation Switch: Although it defaults to mobile crawling, switching to desktop device simulation can reveal the impact of CSS loading priority on JS execution order when handling sites with complex responsive logic.
- Rendering Snapshot Comparison: The screenshots provided by the system are not just visual references; they are the basis for judging whether “Content Shift” or “Layout Shift” occurs, as drastic layout changes may lead Googlebot to misjudge the page’s usability.
“The Rich Results Test is not only for validating structured data; it is a laboratory for testing dynamic content visibility. If text on a page is loaded asynchronously via JS, searching for that text in the ‘View Tested Page’ is the fastest way to verify SEO indexing success rates.”
When a page contains JSON-LD or Microdata injected via scripts, the tool extracts this structured information from the rendered DOM.
If there are syntax errors in the code, or if the script stops running due to JS errors before injecting Schema markup, the tool will report “No rich results detected.”
This detection is particularly important for e-commerce or review sites, as Google needs to identify specific attributes like price, stock status, and ratings while indexing.
If these attributes are missing in the “View Tested Page” HTML, the Search Engine Results Page (SERP) will not display star ratings or price previews, even if the front-end looks normal.
Special attention should be paid to console error logs, as the WRS environment has stricter memory usage limits than a typical user’s browser.
If scripts consume too much CPU, Googlebot may discard the rendering of that page, leaving only an empty shell template in the index.
- Total Number of Loaded Resources: It is recommended to keep JS resources requested per page under 50. Too many parallel requests cause WRS scheduling delays, increasing the risk of rendering failure.
- Script Execution Error Monitoring: The tool captures fatal exceptions like
ReferenceErrororTypeErrorthat break the rendering chain. If you see ES specification incompatibility errors due to missing Polyfills, you should immediately adjust the build tool’s compilation target. - API Response Validity: Check all API endpoints for dynamically pulled content through the resource list. If the status shows “Blocked” or “Timeout,” it means Googlebot is blocked by a firewall or API performance fails to meet the crawling threshold.
Every “Warning” or “Error” in the report generated by this test tool corresponds to Googlebot’s behavior in the real indexing environment.
If the tool suggests “Some scripts could not be loaded,” even if these scripts run normally in a user’s Chrome browser, it must be taken seriously, as it may indicate that Googlebot’s crawler IP range is being Rate Limited by the server when accessing these resources.
Chrome DevTools
In a local development environment, the “Network conditions” panel provided by Chrome DevTools is the starting point for simulating Googlebot’s crawling behavior.
Open the toolbar by pressing F12 or right-clicking and selecting “Inspect,” then go to More tools -> Network conditions from the three-dot menu in the upper right corner.
In this panel, uncheck “Use browser default” and manually select Googlebot from the dropdown list.
This action modifies the User-Agent string sent by the browser, for example, changing it to Mozilla/5.0 (compatible; Googlebot/2.1; +http://www.google.com/bot.html).
The purpose of this step is to detect if the server has special logic for crawlers.
If the server is configured to return different HTML code based on the UA, the local environment will immediately show response results quite different from those of a normal user visit.
Technicians should compare the response headers at this time to check if Content-Type or Cache-Control directives have changed.
If the server returns a 403 Access Denied or an unexpected 301 Redirect for Googlebot, it means the indexing path for search engines is blocked at the server level.
To simulate Googlebot’s “First-wave indexing,” you must test the page performance with JavaScript disabled.
Go to the DevTools Settings page, find the Debugger section in Preferences, and check “Disable JavaScript.”
After refreshing the page, the browser will only render the original HTML structure sent by the server.
For sites using SPA architecture, this often results in a completely blank page or only a loading animation.
If the main text information, navigation menus, or product lists all disappear after disabling scripts, it means search engines must enter the complex “second-wave indexing” (the WRS rendering stage) to obtain content.
At this point, you should record the original HTML byte count—for example, 15KB of basic framework code—and compare it with the fully rendered DOM to determine the scale of JS-injected content.
“In a local simulation environment, disabling JavaScript is the most effective stress test. If a page’s original HTML lacks H1 tags or body paragraphs containing major semantic information, the page faces a very high risk of being indexed as a blank page when network conditions fluctuate or Google’s rendering quota is tight.”
Googlebot does not run in a high-performance desktop environment. Using the “Performance” panel in DevTools can more realistically simulate Googlebot’s computing power.
In the performance settings, adjust CPU Throttling to 4x or 6x slowdown.
If a rendering task that takes only 800ms on a high-performance MacBook grows to 5500ms under 6x slowdown, it has already hit Googlebot’s common 5-second rendering threshold.
By looking at Long Tasks in the flame chart, you can identify which large JS libraries are blocking the main thread and causing rendering delays.
If quantitative indicators like Total Blocking Time (TBT) exceed 2000ms in this environment, it usually predicts that Googlebot may stop waiting before the content is fully generated and instead capture an incomplete DOM snapshot.
Manual Browser Verification
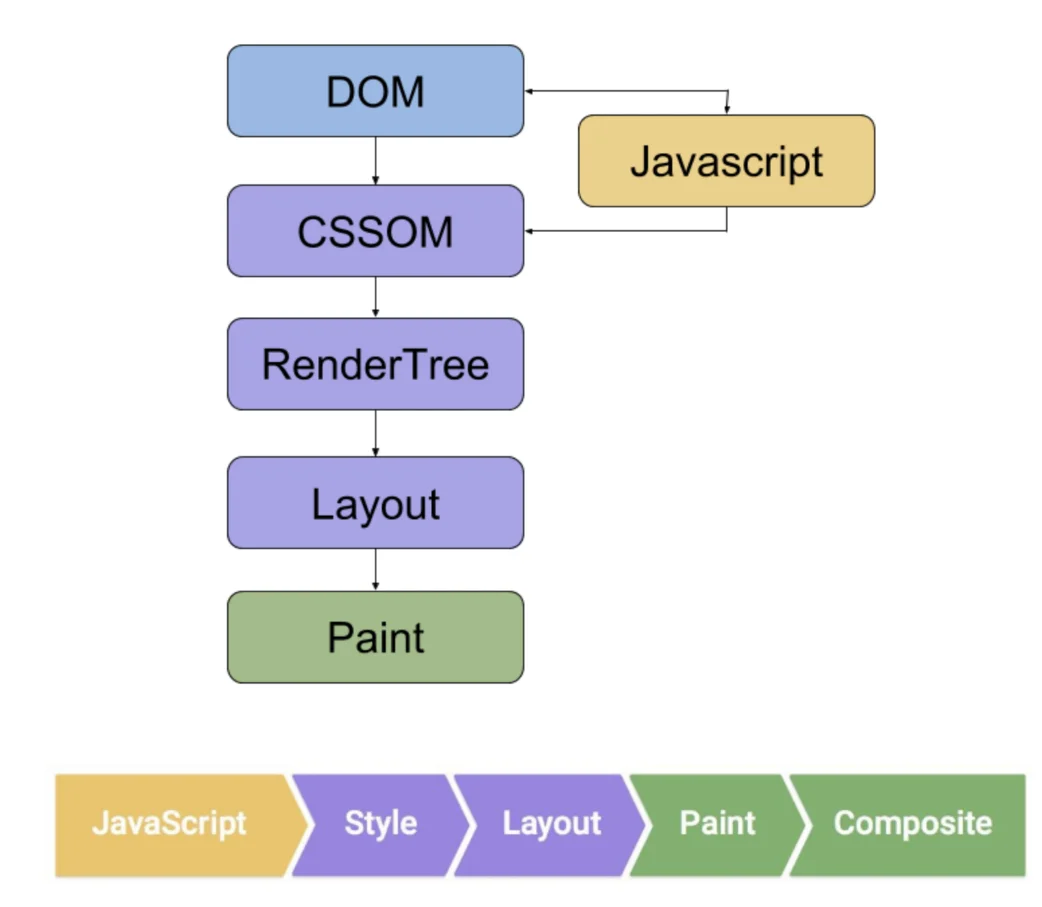
Manual verification confirms the rendering status by comparing data differences between the Initial HTML and the Rendered DOM.
Googlebot uses the latest Chrome rendering engine, but if JS execution exceeds the 5-second threshold or single-page resource requests exceed 50, content may not be indexed.
Manual testing should focus on the resource loading chain, ensuring that the href attribute of <a> tags is present in the HTML source rather than dynamically generated via onclick events, to ensure the continuity of the crawler’s path.
Source Code vs. Live DOM
Code viewed through view-source in a browser reflects the original text stream sent by the server, while the Elements panel in developer tools shows the memory Object Model (DOM) after parsing by the rendering engine, script execution, and error correction.
For SPA sites, the original source code often contains only an empty container tag with id="app" or id="root" and several script references totaling over 500KB.
Comparing the plain text character count in the source code with that in the rendered DOM—when this ratio exceeds 1:20 (e.g., original HTML has 100 words while the rendered version has 2000)—it means the search engine’s first wave of crawling can hardly obtain any effective semantic information.
This difference causes the page to be in a content vacuum during early indexing, requiring the second wave of the rendering queue.
| Comparison Dimension | Initial HTML Characteristics | Rendered DOM Characteristics | Indexing Impact of Tech Difference |
|---|---|---|---|
| Total DOM Nodes | Usually < 50 nodes, extremely flat structure. | May exceed 1500 nodes, increased hierarchy depth. | A surge in nodes means content depends entirely on JS. |
| Meta Tag Status | Contains generic titles or hard-coded placeholders. | Contains specific SEO tags injected by scripts. | Crawlers may record incorrect metadata before scripts run. |
| Canonical Tag | Missing or points to a fixed home URL. | Dynamically updated to the current absolute path. | Inconsistent tags cause indexing conflicts. |
| JSON-LD Data | Empty or just a basic Schema framework. | Filled with product price, reviews, or stock data. | Determines if rich snippets can be shown in SERPs. |
| Internal Links | Nav bar may be empty; links not yet generated. | Contains complete <a> tags and dynamic paths. |
Affects efficiency in discovering deep URLs. |
During deep comparison, you can get the total character count after rendering by entering document.body.innerText.length in the console and comparing it with the byte size of the source code file.
If the source code is 30KB but the rendered innerText reaches 15,000 characters, the main text weight is concentrated in the rendering layer.
At this point, if there is a recursive function in the script that takes more than 200ms to execute, or an external API reference with a loading time exceeding 2.0s, Googlebot’s rendering engine may stop recording before content is fully injected due to resource allocation policies.
| Quantitative Indicator | Risk Threshold | Consequences for Crawling & Indexing |
|---|---|---|
| Text Ratio Gap | > 80% of text generated by JS | Page is easily judged as “thin content” without scripts. |
| Link Extraction Rate | < 5 valid <a> tags in source |
Crawl budget is wasted in endless waiting. |
| Script Memory Usage | > 50MB heap memory consumption | Rendering tasks may be terminated due to memory limits. |
| Above-the-fold Integrity | < 10% main content visible in source | Users see long blank screens, hurting ranking signals. |
Check the navigation menu in the Elements panel. If a link shows as <a href="javascript:void(0)" onclick="navigateTo('/page')">, it looks like a link in the rendered DOM but is a dead end for search engine crawlers.
Standard href attributes must exist in the original HTML or be generated as <a href="/en/target-path/"> after script execution.
Sites with full original HTML link structures usually have their new pages indexed 40% to 70% faster than sites relying entirely on JS-injected links.
If a noindex meta tag exists in the source code and the script logic tries to remove it and replace it with index after rendering, this practice is usually ineffective.
Search engines prioritize instructions found in the initial HTML, which may prevent the page from being indexed normally.
Environment Simulation Validation
In Chrome DevTools, press Ctrl+Shift+P to bring up the command menu, type “Disable JavaScript” and hit enter. This is the starting point for simulating the initial crawl state.
Reload the page with scripts disabled. If the screen is blank or shows only a basic framework, it means the server-side Initial HTML contains no substantial text content.
For a 100KB HTML file, if 90% of its text relies on a subsequent 2MB JavaScript bundle, there is a high chance search engines will only record an empty container tag during network delays or script errors.
| Simulation Parameter | Standard & Value | Observation & Data Metrics |
|---|---|---|
| Network Throttling | Fast 3G (1.5 Mbps down, 40ms latency) | If rendering takes > 5000ms, Google may stop waiting. |
| CPU Throttling | 4x slowdown (Mobile CPU performance) | Script Evaluation > 1.5s causes delayed rendering. |
| User-Agent Simulation | Googlebot Smartphone | Check for 403 errors or specific mobile-adaptive code. |
| Viewport Size | 411 x 731 pixels (Std Mobile Width) | Confirm if content loads without clicks or scrolls. |
Change the browser’s User-Agent string to the Googlebot string.
Check “Disable cache” in the Network panel and observe the resource loading chain under the Googlebot identity.
In standard crawling, Googlebot usually doesn’t load all media files; it prioritizes text and structured data.
If the page detects the User-Agent via script and implements different logic—for example, closing certain asynchronous interfaces for crawlers—the DOM structure in the Elements panel will be completely different from what a normal user sees.
Set the network speed to Fast 3G and CPU to 4x slowdown in the Network panel.
Googlebot’s rendering servers have limited resources. Use the Performance panel to record the loading process and focus on Main thread activity.
If Evaluate Script generates Long Tasks exceeding 50ms and they total more than 70% of the loading cycle, the rendering engine might finish the snapshot before content is fully filled in a real crawling environment.
If the gap between First Contentful Paint (FCP) and Largest Contentful Paint (LCP) widens to over 3 seconds due to long JS execution, the probability of the search engine capturing a fragmented page increases by about 40%.
Use the Sensors tab in DevTools to manually simulate different geographic locations (like San Francisco or London).
Googlebot’s crawl nodes are mainly in the US. If the JS logic includes automatic redirection or content generation based on IP or local timestamps, it might lead to a version of the page being crawled that doesn’t match the target audience’s region.
Check for error messages in the Console panel, especially ReferenceError or TypeError.
Although the Evergreen Googlebot stays updated, there may be support differences for extremely new Web APIs. Without proper Polyfill compatibility, scripts might crash halfway, stopping the DOM tree construction.
- Request Count Limit: Count the total network requests before rendering finishes. If a single page requests more than 50 JS or CSS resources, some scripts might not load in time due to concurrency limits and crawler quotas.
- Shadow DOM Status: Check for
#shadow-root (closed)in the Elements panel. Googlebot can parse Open Shadow DOM, but Closed content is invisible to it. - Link Format Verification: Use
Ctrl+Fto search for<atags in the rendered DOM. Ensure all links havehrefattributes. If jumps are controlled bywindow.location.hrefwithout standard anchors, search engines won’t find those sub-pages. - Image Lazy Load: Check if
<img>tags have replaceddata-srcwithsrcwithout scrolling. Using standardloading="lazy"is safer than relying on complex scroll event listeners.
Compare the byte size and text node count of the Initial HTML and Rendered DOM.
If the text coverage difference exceeds 80% and most text is injected after the DOMContentLoaded event, the site’s SEO is highly dependent on rendering efficiency.
If Total Blocking Time (TBT) exceeds 300ms, it usually indicates script execution will hinder the crawler’s DOM parsing.
Use the Coverage panel in Chrome to see JS file utilization. If 80% of a 500KB script is unused on the initial load, this redundancy wastes the rendering server’s computation, affecting indexing speed.
Professional Crawler Tools
Professional crawler tools (like Screaming Frog v20+) can simulate the Chrome environment.
Data shows that the crawling cost for executing scripts is 20 times higher than for static HTML.
When the HTML word count difference between “Pre-rendering” and “Post-rendering” exceeds 10%, or the internal link identification difference exceeds 5%, indexing success rates usually drop.
Detection should focus on the rendering completion rate within 5 seconds and whether script loading failed due to 403 status codes.
Screaming Frog SEO Spider
When using Screaming Frog for large-scale crawling, switching the rendering mode from “Text Only” to “JavaScript” changes the crawler’s behavior from simple HTTP requests to full browser simulation.
The software launches underlying Headless Chrome instances to parse every script file on the page.
In terms of configuration, users need to select the JavaScript option in Configuration > Spider > Rendering.
The change in data is significant: the demand for RAM usually increases by 5 to 10 times when executing JavaScript.
For example, when crawling 100,000 pages with complex React or Angular frameworks, it is recommended to allocate at least 16GB to 32GB of RAM to the software, otherwise the Chrome rendering process may crash.
| Metric Category | Source HTML (Original) | Rendered HTML | Threshold Suggestion |
|---|---|---|---|
| Word Count | Only basic framework & meta | Contains async loaded text | Difference > 15% needs review |
| Internal Links | 0 or very few placeholders | Dynamic nav & product links | Difference > 0 indicates risk |
| Canonical Tag | May be missing or default | Final version modified by JS | Must follow the rendered version |
| Page Size | Usually < 50 KB | May grow to 500 KB – 2 MB | Too large might be truncated |
When the software simulates script execution, the AJAX Timeout defaults to 5 seconds, similar to Googlebot’s strategy.
If an interface responds slowly and content is filled after 5 seconds, Screaming Frog will capture an “empty shell” page.
You can quantify this by comparing the Word Count column: if the rendered word count is less than the source count, or they are identical but the page has lots of text, it usually means rendering didn’t finish in time.
In tests for e-commerce sites, if product lists load via dynamic scrolling, the crawler can trigger script execution by configuring “Window Size” or simulating downward scrolling to capture hidden product info.
For technical audits of large sites, the “JavaScript Rendering Table” in “Bulk Export” can export a sitewide rendering difference report, listing changes in Title, Meta Description, and H1 tags for every URL.
The software’s “Resource” tab records the HTTP status code for every JS and CSS file. If functional scripts return 403 Forbidden, it’s often because a Web Application Firewall (WAF) misidentified the Headless Chrome behavior as an attack, causing rendering to fail.
| Resource Status | Reason | Impact on Crawling |
|---|---|---|
| Blocked by robots.txt | Script path set to Disallow | Googlebot can’t read script; fails |
| Status Code: 429 | Request frequency too high | Incomplete resource loading |
| Status Code: 404 | Invalid script file path | Dynamic components won’t show |
| Timeout (> 5s) | Slow API or complex logic | HTML is empty or shows error |
The “Rendered Page” view allows users to compare original code snapshots and rendered visual snapshots side-by-side. This helps find content hidden by JavaScript, such as text in tabs that only appears after a click.
Screaming Frog also captures Console Errors. If a page generates fatal JS syntax errors, the software highlights them in the report.
By analyzing “Link Discovery” differences, you can calculate the percentage of internal links that require script execution to be found. If this exceeds 30%, the site’s Crawl Depth becomes uncontrollable due to rendering delays.
Lumar (DeepCrawl)
Lumar uses distributed cloud computing to provide automated scanning for large sites with millions of URLs.
While local tools are limited by physical memory—for instance, a 32GB RAM PC might only support 20 to 50 parallel threads in rendering mode—Lumar can scale to over 500 threads on cloud servers, ensuring full rendering of 1 million pages within 24 hours.
If a script runs longer than 5000ms, the system marks the URL as a “high-cost page,” as Googlebot won’t wait that long, leading to blank content in the index.
In a standard React or Vue project, the 100x byte growth from 2KB-5KB (source) to 300KB-800KB (DOM tree) indicates high script dependency.
Lumar’s DOM Node Count identifies if nodes exceed the 1500 suggested by Google, which would drop rendering efficiency.
By recording Time to Interactive and Total Blocking Time in the cloud, it identifies large JS files (e.g., > 500KB vendor.js) that block content display.
Lumar’s report generates a “Rendering Difference Map,” detailing changes in internal link counts with JS on versus off. If links drop from 200 to 0 without scripts, the site’s discovery structure is entirely dependent on dynamic execution, which slows down Googlebot’s discovery of new pages.
It also integrates with Google Search Console APIs. If data shows word count increased by 300% after rendering but search traffic didn’t rise, it might mean the dynamically inserted content isn’t being effectively recognized by Google.
Lumar outputs the Rendered Page Word Count and compares it with the Source HTML Word Count. Pages with a larger Ratio Gap are often more unstable in crawl frequency. Observations of over 500,000 samples show that when the Rendering Gap exceeds 80%, indexing delays typically increase by 3 to 7 days.